Sell tickets and manage registrations
 View my tickets and registrations
 Sell more tickets through digital marketing
 Add an event calendar to your website
 Find events by location and categories
Microsoft Power BI Desktop Introduction
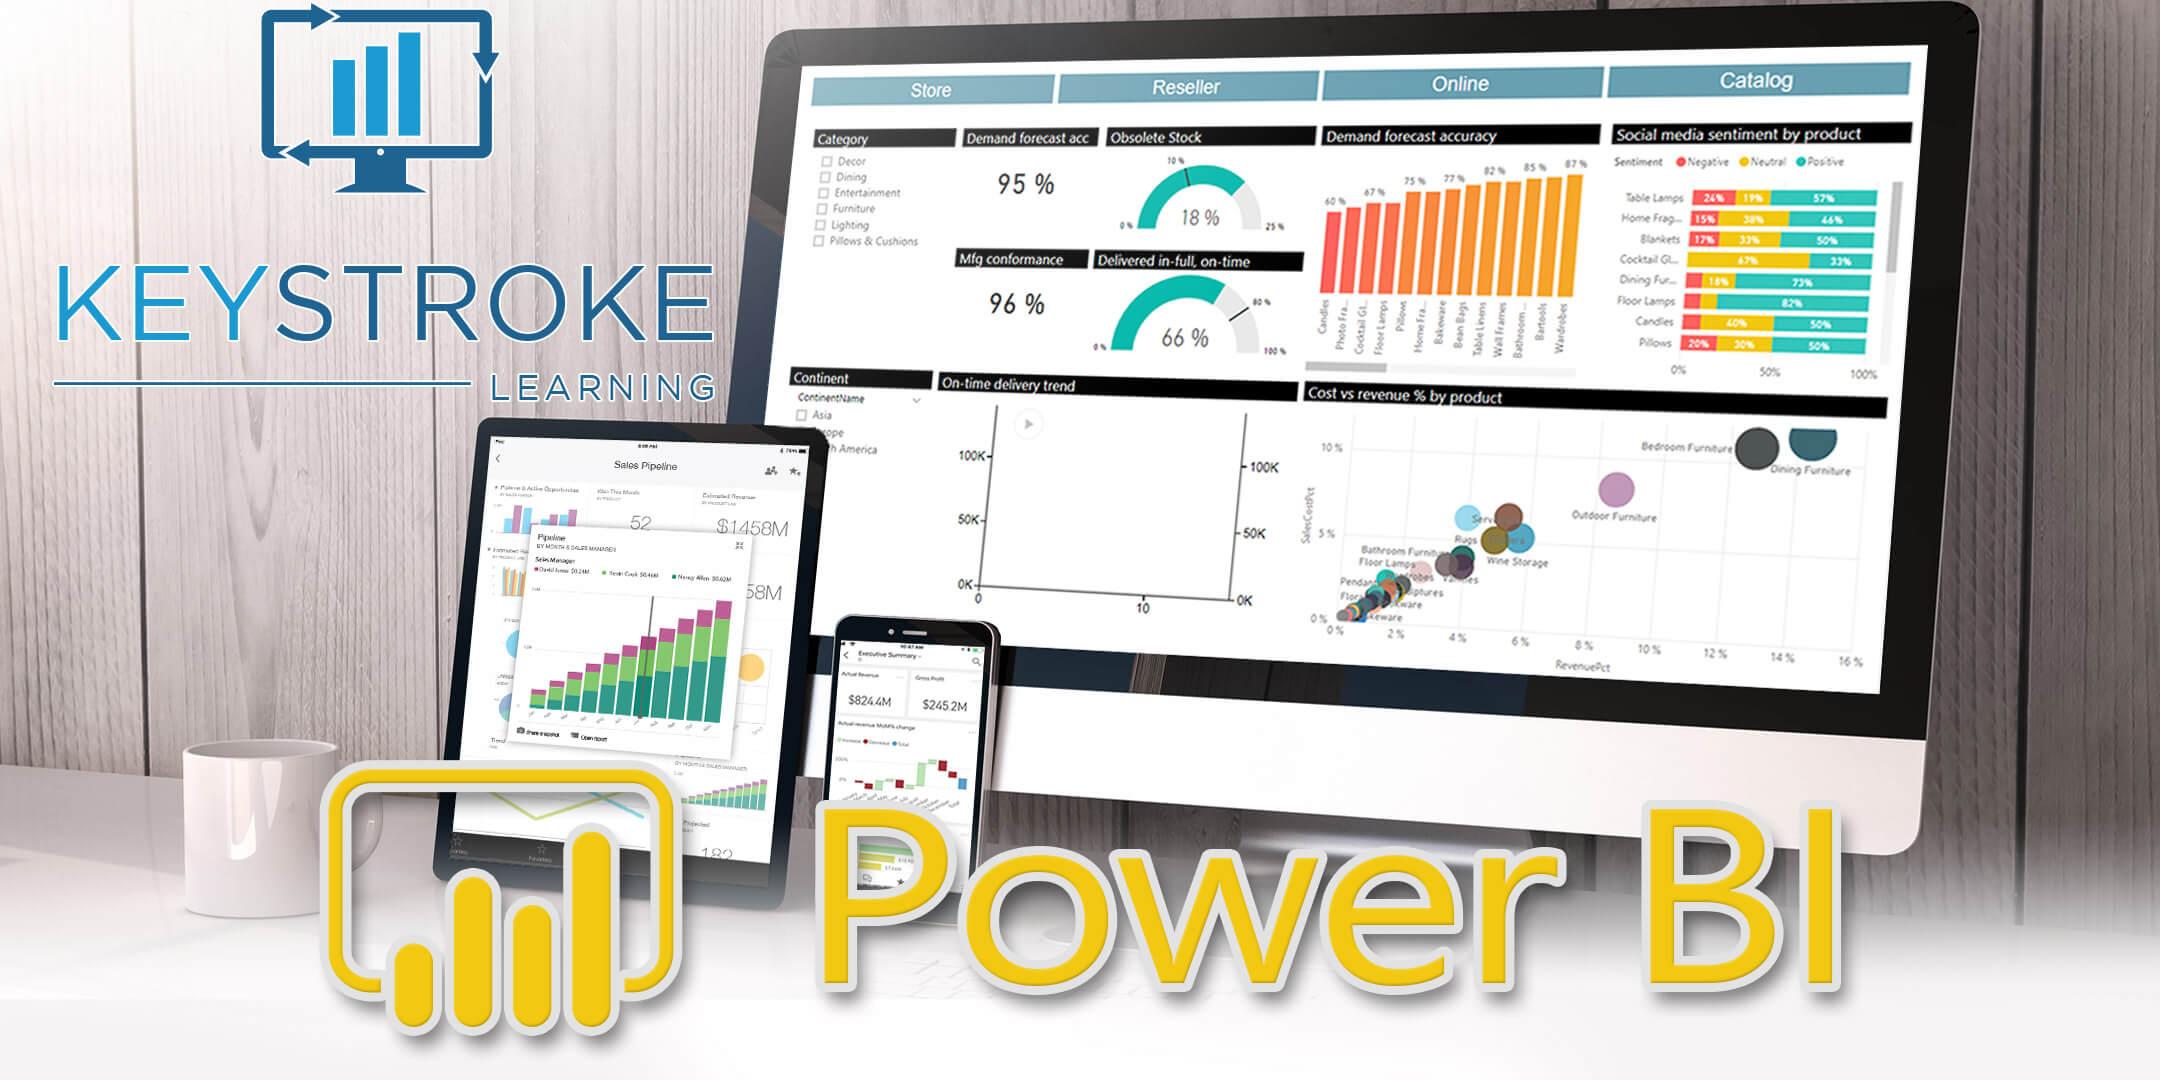
Are you tired of wrangling slow and complicated Excel spreadsheets? Do you want to make better use of the data you already have? Then join us for this hands-on training workshop. You will learn the basics of Power BI Desktop, starting with connecting to your data, then modelling and transforming it.
Once your data is prepared, you’ll use Power BI Desktop to quickly create real time analytics and visualisations to gain valuable insights for data driven decision making.
This is an introductory level course.
What you get
- Class size kept to a maximum of 10 participants.
- Average class is 4-6 people.
- Qualified, experienced and approachable facilitators.
- Training materials and take away practice files.
- Lifetime post course support.
We encourage you to bring along your own laptop so you are familiar with its layout and functionality. If you do not have a laptop, we can supply one on the training day.
Microsoft Power BI Introduction Course Content
Introduction to BI
- What is Business Intelligence?
- Components of BI Software
- The Power BI Product Family
Power BI Desktop Orientation
- What is Power BI Desktop?
- Setting up Power BI Desktop
- The Desktop Window
- Navigating Power BI Desktop
Connecting to your Data
- Getting Data
- Connecting to Databases
- Connecting to Website Data
- Connecting to Excel Spreadsheets
Transforming your Data
- About the Power Query Editor
- Removing and Filling Blanks
- Setting Column Headings
- Removing Columns
- Replacing Values
- Changing Data Types
- Trimming Text
- Editing Applied Steps
Data Modelling
- About Relationships and Data Modelling
- Viewing Relationships
- Removing, Creating and Managing Relationships
- Hiding Tables
- Working with DAX
- Creating Calculations
Creating Visualisations
- About Visualisations
- Using the Visualisations Pane
- Adding Report Pages
- Creating Tables
- Creating Cards
- Building Charts
- Working with Maps
- Custom Visualisations
Using Filters
- Highlighting and Filtering Visuals
- Defining Visual Interactions
- Using Spotlight and Focus Modes
- Setting Filter Levels
- Top N Filters
Publishing Reports
- About Publishing
- Publhising a Report
- Using Power BI Service
- Sharing Reports
If you need to book a course after the ticket sales have closed, please get in touch and we'll do our best to accommodate you.
See here for